Increasing willingness to interact in remote learning environments
HeyClass • 2023
Impact: +18-39% uplift in willingness to participate
Role: Project Lead (Experience Designer)
Increasing willingness to interact in remote learning environments
HeyClass • 2023
Impact: +18-39% uplift in willingness to participate
Role: Project Lead (Experience Designer)
Increasing willingness to interact in remote learning environments
HeyClass • 2023
Impact: +18-39% uplift in willingness to participate
Role: Project Lead (Experience Designer)
Increasing willingness to interact in remote learning environments
HeyClass • 2023
Impact: +18-39% uplift in willingness to participate
Role: Project Lead (Experience Designer)
SUMMARY
HeyClass: Helping students engage in online learning without pressure
SUMMARY
HeyClass: Helping students engage in online learning without pressure
SUMMARY
HeyClass: Helping students engage in online learning without pressure
In remote learning environments, forming connections with peers can be difficult. Without the casual interactions of in-person classes, collaboration and communication can feel intimidating – discouraging students from asking questions or seeking support when they need it.
HeyClass reduces the social risk of participation by:
Guiding students straight into participating instead of confronting an empty dashboard
Letting students ask questions under playful aliases
Using encouraging microcopy to make participation feel safe and approachable

SITUATION
When university suddenly went online, the learning experience didn’t catch up
SITUATION
When university suddenly went online, the learning experience didn’t catch up
SITUATION
When university suddenly went online, the learning experience didn’t catch up
During the COVID-19 pandemic, universities rapidly shifted to emergency remote learning.² While this enabled continuity, it also brought measurable challenges to the student experience.
Research at the time showed notable declines in performance and wellbeing compared to pre-pandemic:
40.5% of students reported lower grades¹
Moderate‑to‑severe anxiety among college students rose from 18.1% to 25.3%³
Moderate‑to‑severe depression rose from 21.5% to 31.7%³
This project aimed to identify gaps in emergency remote learning and design a digital learning platform to improve the student experience without increasing instructors’ workload or disrupting their existing workflows.
COMPLICATION
Existing channels don’t support casual, immediate, and low-pressure communication
COMPLICATION
Existing channels don’t support casual, immediate, and low-pressure communication
COMPLICATION
Existing channels don’t support casual, immediate, and low-pressure communication
To understand how emergency remote learning contributed to these outcomes, I conducted primary research to uncover students’ needs, pain points, and behaviours.
I ran 12 semi-structured interviews with undergraduate students who experienced the transition to remote learning in their second or third year. I then followed up with a survey to validate and prioritise the themes that emerged.

Interview highlights
The follow-up survey validated the interview themes and revealed the biggest pain points:
83% of students felt that communication barriers with teachers negatively affected their grades (e.g., delayed email responses, limited 1:1 time, office hours that conflicted with schedules).
100% of students felt more disconnected from peers compared to face-to-face courses.
Existing online messaging channels didn’t bridge this gap: 75% of students refrained from posting, citing self-consciousness about asking “dumb” or last-minute questions.
These insights were distilled into a representative persona, empathy map, and journey map to keep the design grounded in real student experiences.
These insights were distilled into a representative persona, empathy map, and journey map to keep the design grounded in real student experiences.
These insights were distilled into a representative persona, empathy map, and journey map to keep the design grounded in real student experiences.


QUESTION
How might we encourage dialogue between students…
QUESTION
How might we encourage dialogue between students…
QUESTION
How might we encourage dialogue between students…
… so they can comfortably ask questions, build connections with peers, and gain the clarity they need to succeed in their learning?
… so they can comfortably ask questions, build connections with peers, and gain the clarity they need to succeed in their learning?
… so they can comfortably ask questions, build connections with peers, and gain the clarity they need to succeed in their learning?
To explore this, I quickly generated a range of early concepts.
To explore this, I quickly generated a range of early concepts.
To explore this, I quickly generated a range of early concepts.

Generating early concepts through the Crazy 8s ideation exercise
One concept emerged as the most promising:
#1: A digital experience focused on question-asking as the primary action. This approach best supported the persona’s needs by prioritising immediacy, psychological safety, and ease of use.
I then formed hypotheses about how the design could improve students’ willingness and comfort in asking questions.
These hypotheses were evaluated on the mobile prototype with 12 participants. Because this was an early-stage concept, testing focused on self-reported perceptions and intent rather than observed behaviour. The results provide directional insights for design rather than statistically significant evidence.
ANSWER
Start with asking, not scrolling
ANSWER
Start with asking, not scrolling
ANSWER
Start with asking, not scrolling
Test 1: Design
Test 1: Design
Test 1: Design
In early research, 58% of students reported avoiding asking questions on quiet dashboards, often because they didn’t want to stand out as the only one engaging.
Based on this insight, I formulated the following hypothesis:
Prompting students to ask a question before accessing their course dashboard will increase willingness to submit questions by encouraging immediate engagement and avoiding the discouragement of an empty dashboard.
I ran a three-variant study, using a within-subjects design. Each participant explored all three variants in counterbalanced order to reduce order effects.
Control (33%): Dashboard shows active student activity; question-asking screen accessible from dashboard.
Variant A (33%): Dashboard is empty; question-asking screen accessible from dashboard.
Variant B (33%): Dashboard is empty; question-asking screen appears immediately on app open.
All participants were primed with the same scenario describing a common course challenge. They then explored each flow and rated their willingness and comfort in asking for help.

Test 1: Outcome
Test 1: Outcome
Control vs. Variant A showed that willingness depended strongly on dashboard activity. Perceived willingness was 37% higher when students saw activity in the dashboard:
Control (active dashboard): 5.2 / 7
Variant A (empty dashboard): 3.8 / 7
Variant A vs. Variant B showed willingness increased by ~18% when students were prompted to ask a question before seeing the empty dashboard (though scores remained below the active-dashboard control):
Variant B (empty dashboard, question-screen first): 4.5 / 7
Overall, the results suggest that leading with question-asking increases willingness to engage, even when dashboard activity is low.
Reduce the social risk of asking questions (but make it fun)
Reduce the social risk of asking questions (but make it fun)
Reduce the social risk of asking questions (but make it fun)
Test 2 (Round 1): Design
Test 2 (Round 1): Design
Next, I tested whether reducing identity exposure would increase participation.
Allowing students to hide their identity when submitting questions will increase their willingness to participate.
I then ran a second concept study using the same method as Test 1, after implementing the updated flow informed by Test 1 results:
Variant A (50%): Standard question submission.
Variant B (50%): Standard submission with an “Ask anonymously” feature.
Participants were primed with a new scenario describing a comparable course challenge. They explored both flows and rated willingness and comfort.

Test 2 (Round 1): Outcome
Test 2 (Round 1): Outcome
Willingness improved only marginally:
Variant A (standard): 4.5 / 7
Variant B (anonymous feature): 4.7 / 7
In follow-up probing, several participants explained that the word “anonymous” felt untrustworthy, which made them less comfortable using the feature.
Willingness improved only marginally:
Variant A (standard): 4.5 / 7
Variant B (anonymous feature): 4.7 / 7
In follow-up probing, several participants explained that the word “anonymous” felt untrustworthy, which made them less comfortable using the feature.
Willingness improved only marginally:
Variant A (standard): 4.5 / 7
Variant B (anonymous feature): 4.7 / 7
In follow-up probing, several participants explained that the word “anonymous” felt untrustworthy, which made them less comfortable using the feature.
Test 2 (Round 2): Design
Test 2 (Round 2): Design
Based on this feedback, I iterated on the concept. I kept the underlying anonymity mechanic, but reframed it as “alias mode” – designed to feel friendly, normal, and socially acceptable.
Key changes included:
Replaced “Ask anonymously” with “Ask with an alias”
Introduced playful pre-generated names (e.g., Caffeinated Charlie)

Test 2 (Round 2): Outcome
Test 2 (Round 2): Outcome
After reframing anonymity as alias mode, willingness increased more clearly:
Variant A (standard): 4.5 / 7
Variant B (alias mode): 5.3 / 7
This supported the hypothesis: students were more willing to ask questions when they could participate with lower social risk – as long as the mechanism felt positive and trustworthy.
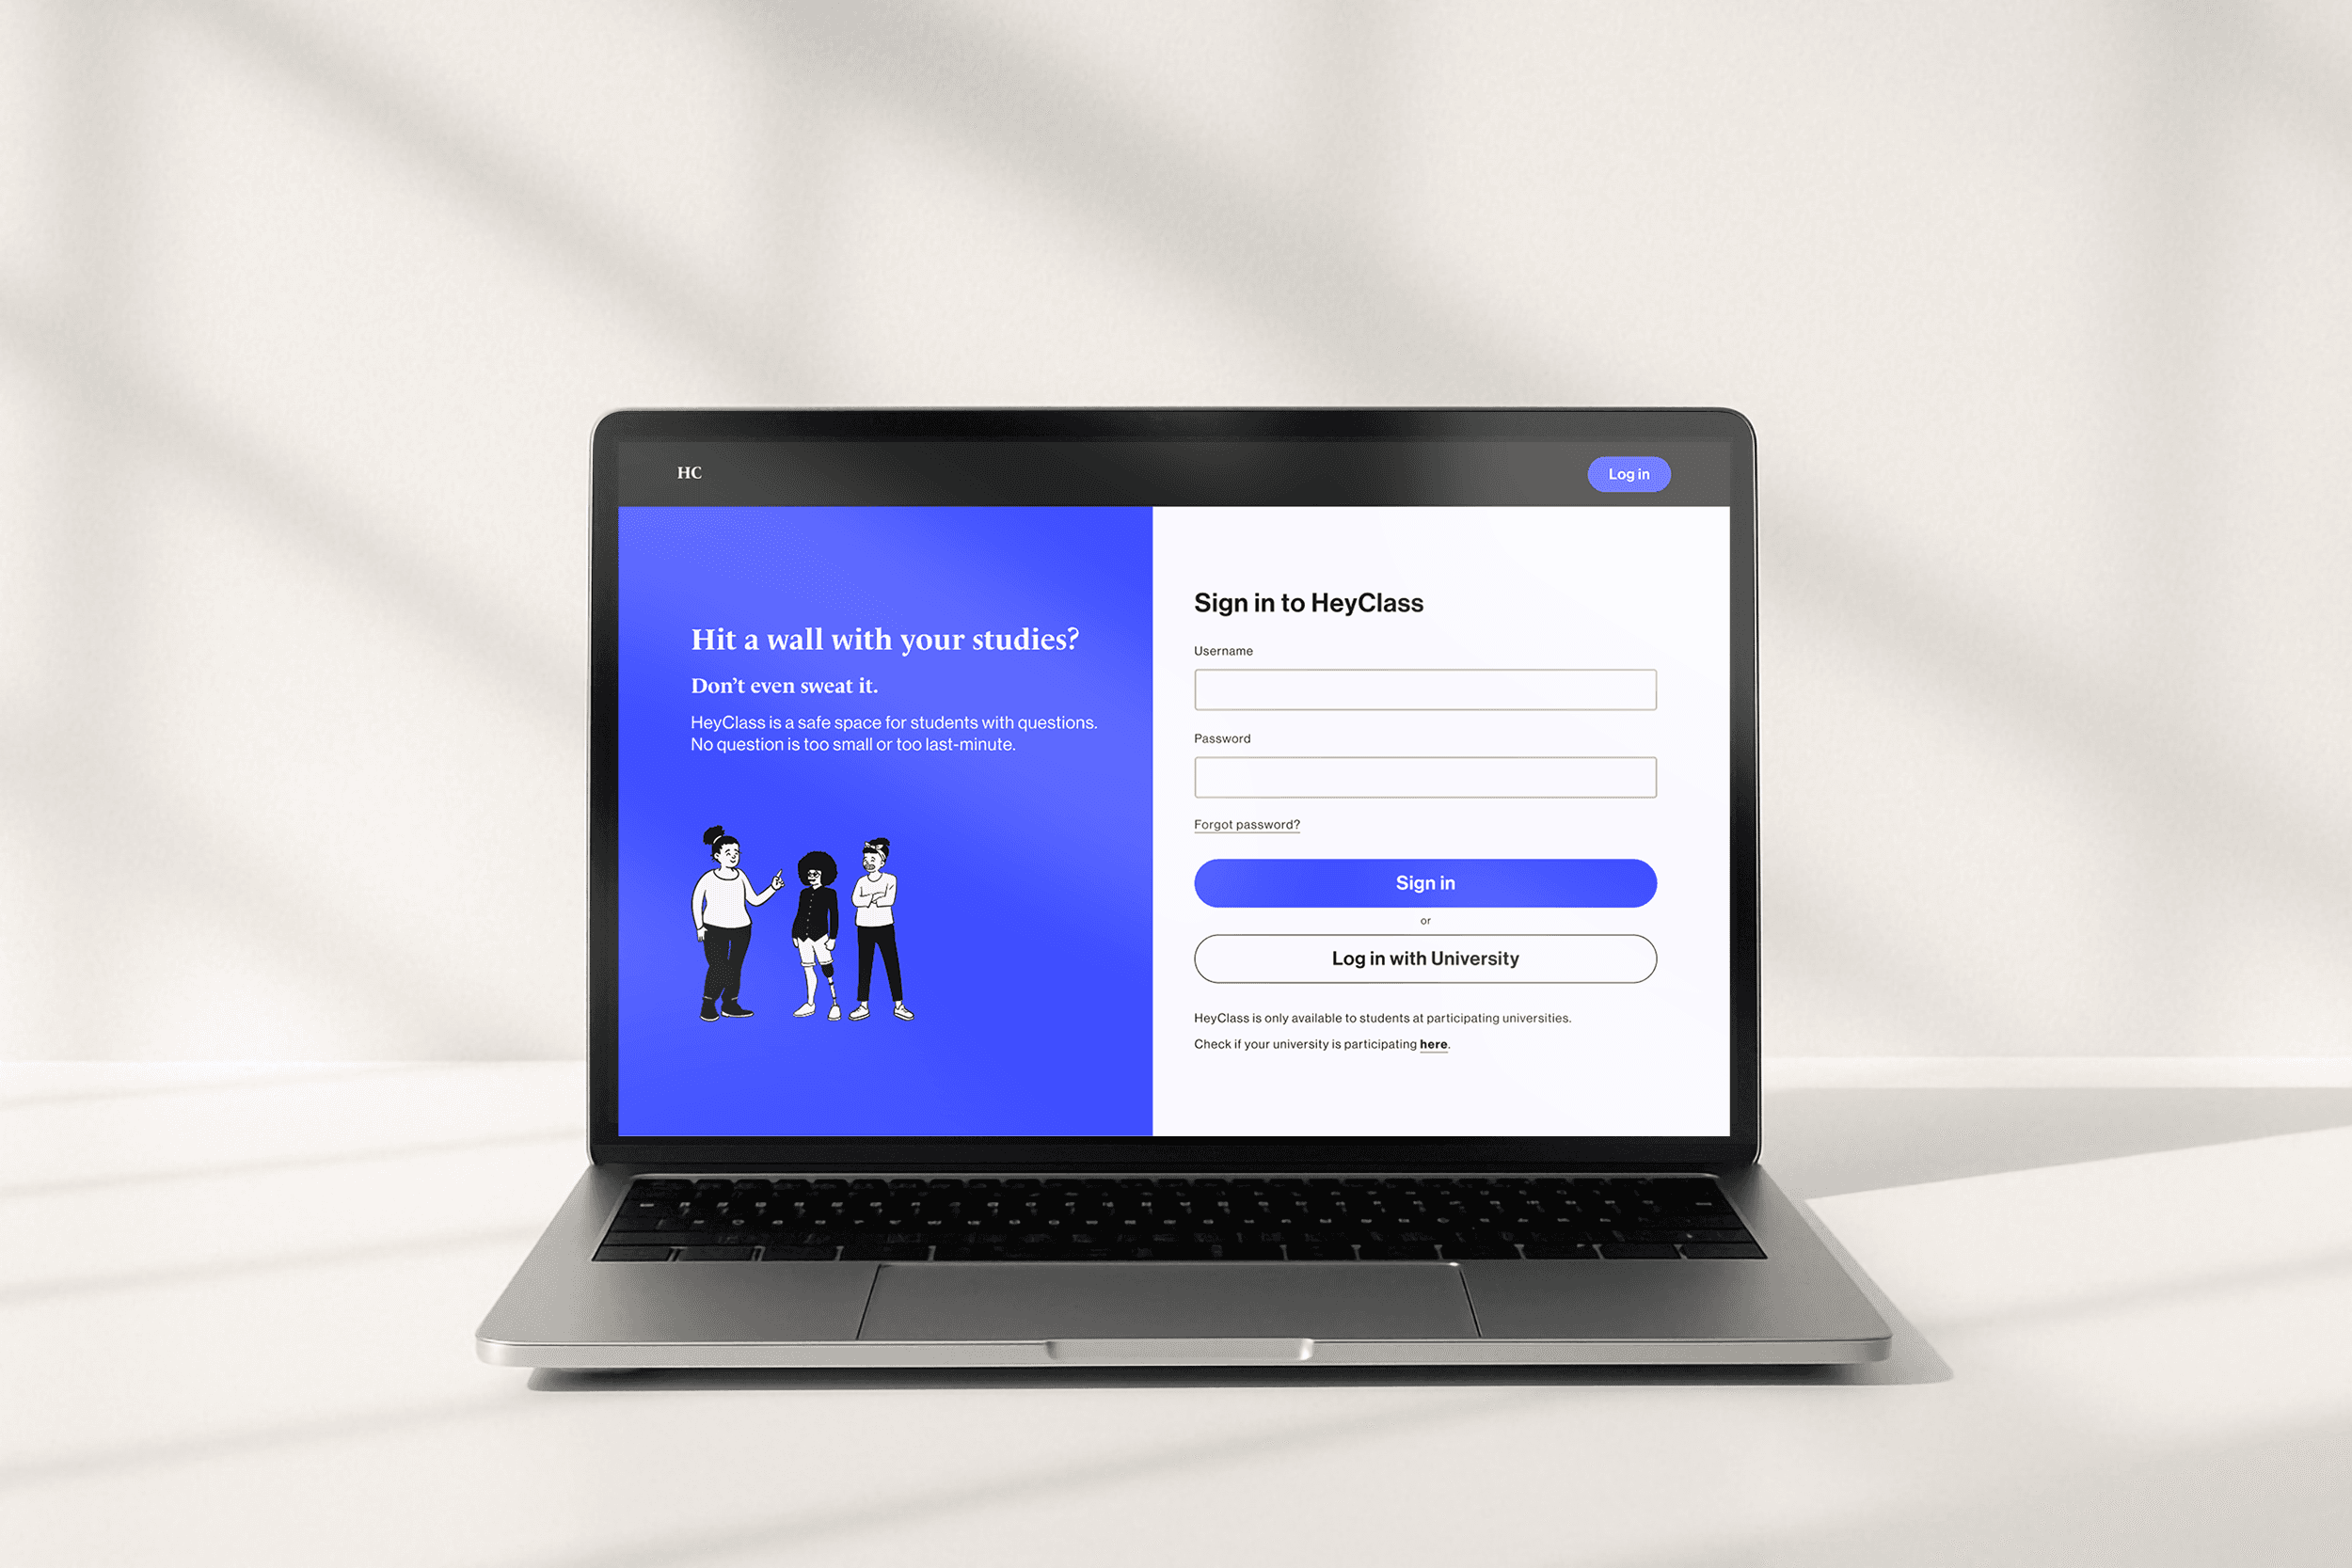
THE FINAL DESIGN
Introducing HeyClass...
Introducing HeyClass...
THE FINAL DESIGN
Introducing HeyClass...


KEY LEARNINGS
Coming up with ideas is easy, testing for the real-world is hard
Coming up with ideas is easy, testing for the real-world is hard
KEY LEARNINGS
Coming up with ideas is easy, testing for the real-world is hard
It’s easy to get swept up in new ideas
It’s easy to get swept up in new ideas
Throughout the process, I found myself considering additional features. This pushed me to build the habit of regularly stepping back and asking: what problem am I solving, and for whom? This helped me prioritise clarity and user value over feature complexity.
Throughout the process, I found myself considering additional features. This pushed me to build the habit of regularly stepping back and asking: what problem am I solving, and for whom? This helped me prioritise clarity and user value over feature complexity.
Throughout the process, I found myself considering additional features. This pushed me to build the habit of regularly stepping back and asking: what problem am I solving, and for whom? This helped me prioritise clarity and user value over feature complexity.
Testing a concept for a real-world context is challenging
Testing a concept for a real-world context is challenging
I quickly realised that testing can only reveal so much. To help participants respond in a way that better reflects real behaviour, I primed them with realistic scenarios drawn from earlier interviews. This helped participants provide quantitative and qualitative feedback grounded in context.
I quickly realised that testing can only reveal so much. To help participants respond in a way that better reflects real behaviour, I primed them with realistic scenarios drawn from earlier interviews. This helped participants provide quantitative and qualitative feedback grounded in context.
I quickly realised that testing can only reveal so much. To help participants respond in a way that better reflects real behaviour, I primed them with realistic scenarios drawn from earlier interviews. This helped participants provide quantitative and qualitative feedback grounded in context.
Resources
Resources
Resources
¹ Barbosa‑Camacho et al. (2022). Depression, anxiety, and academic performance in COVID‑19: A cross‑sectional study. BMC Psychiatry, 22, Article 443. https://doi.org/10.1186/s12888-022-04062-3
² Czerkawski, B. C. (2022). Shifting online during COVID‑19: A systematic review of teaching and learning strategies and their outcomes. International Journal of Educational Technology in Higher Education, 19, Article 56. https://doi.org/10.1186/s41239-022-00361-7
³ Fruehwirth, J. C., Biswas, S., & Perreira, K. M. (2021). The COVID‑19 pandemic and mental health of first‑year college students: Examining the effect of COVID‑19 stressors using longitudinal data. PLoS ONE, 16(3), e0247999. https://doi.org/10.1371/journal.pone.024799
⁴ Stanley, P. (n.d.). OpenPeeps: Hand-drawn illustration library.
https://www.openpeeps.com/
Thanks for coming by!
I’m always up for connecting with new people, so feel free to get in touch.
Thanks for coming by!
I’m always up for connecting with new people, so feel free to get in touch.
Thanks for coming by!
I’m always up for connecting with new people, so feel free to get in touch.
Thanks for coming by!
I’m always up for connecting with new people, so feel free to get in touch.